Visualizing Data for Publications Using smplot2
Last Updated: 2026-03-02
Welcome!
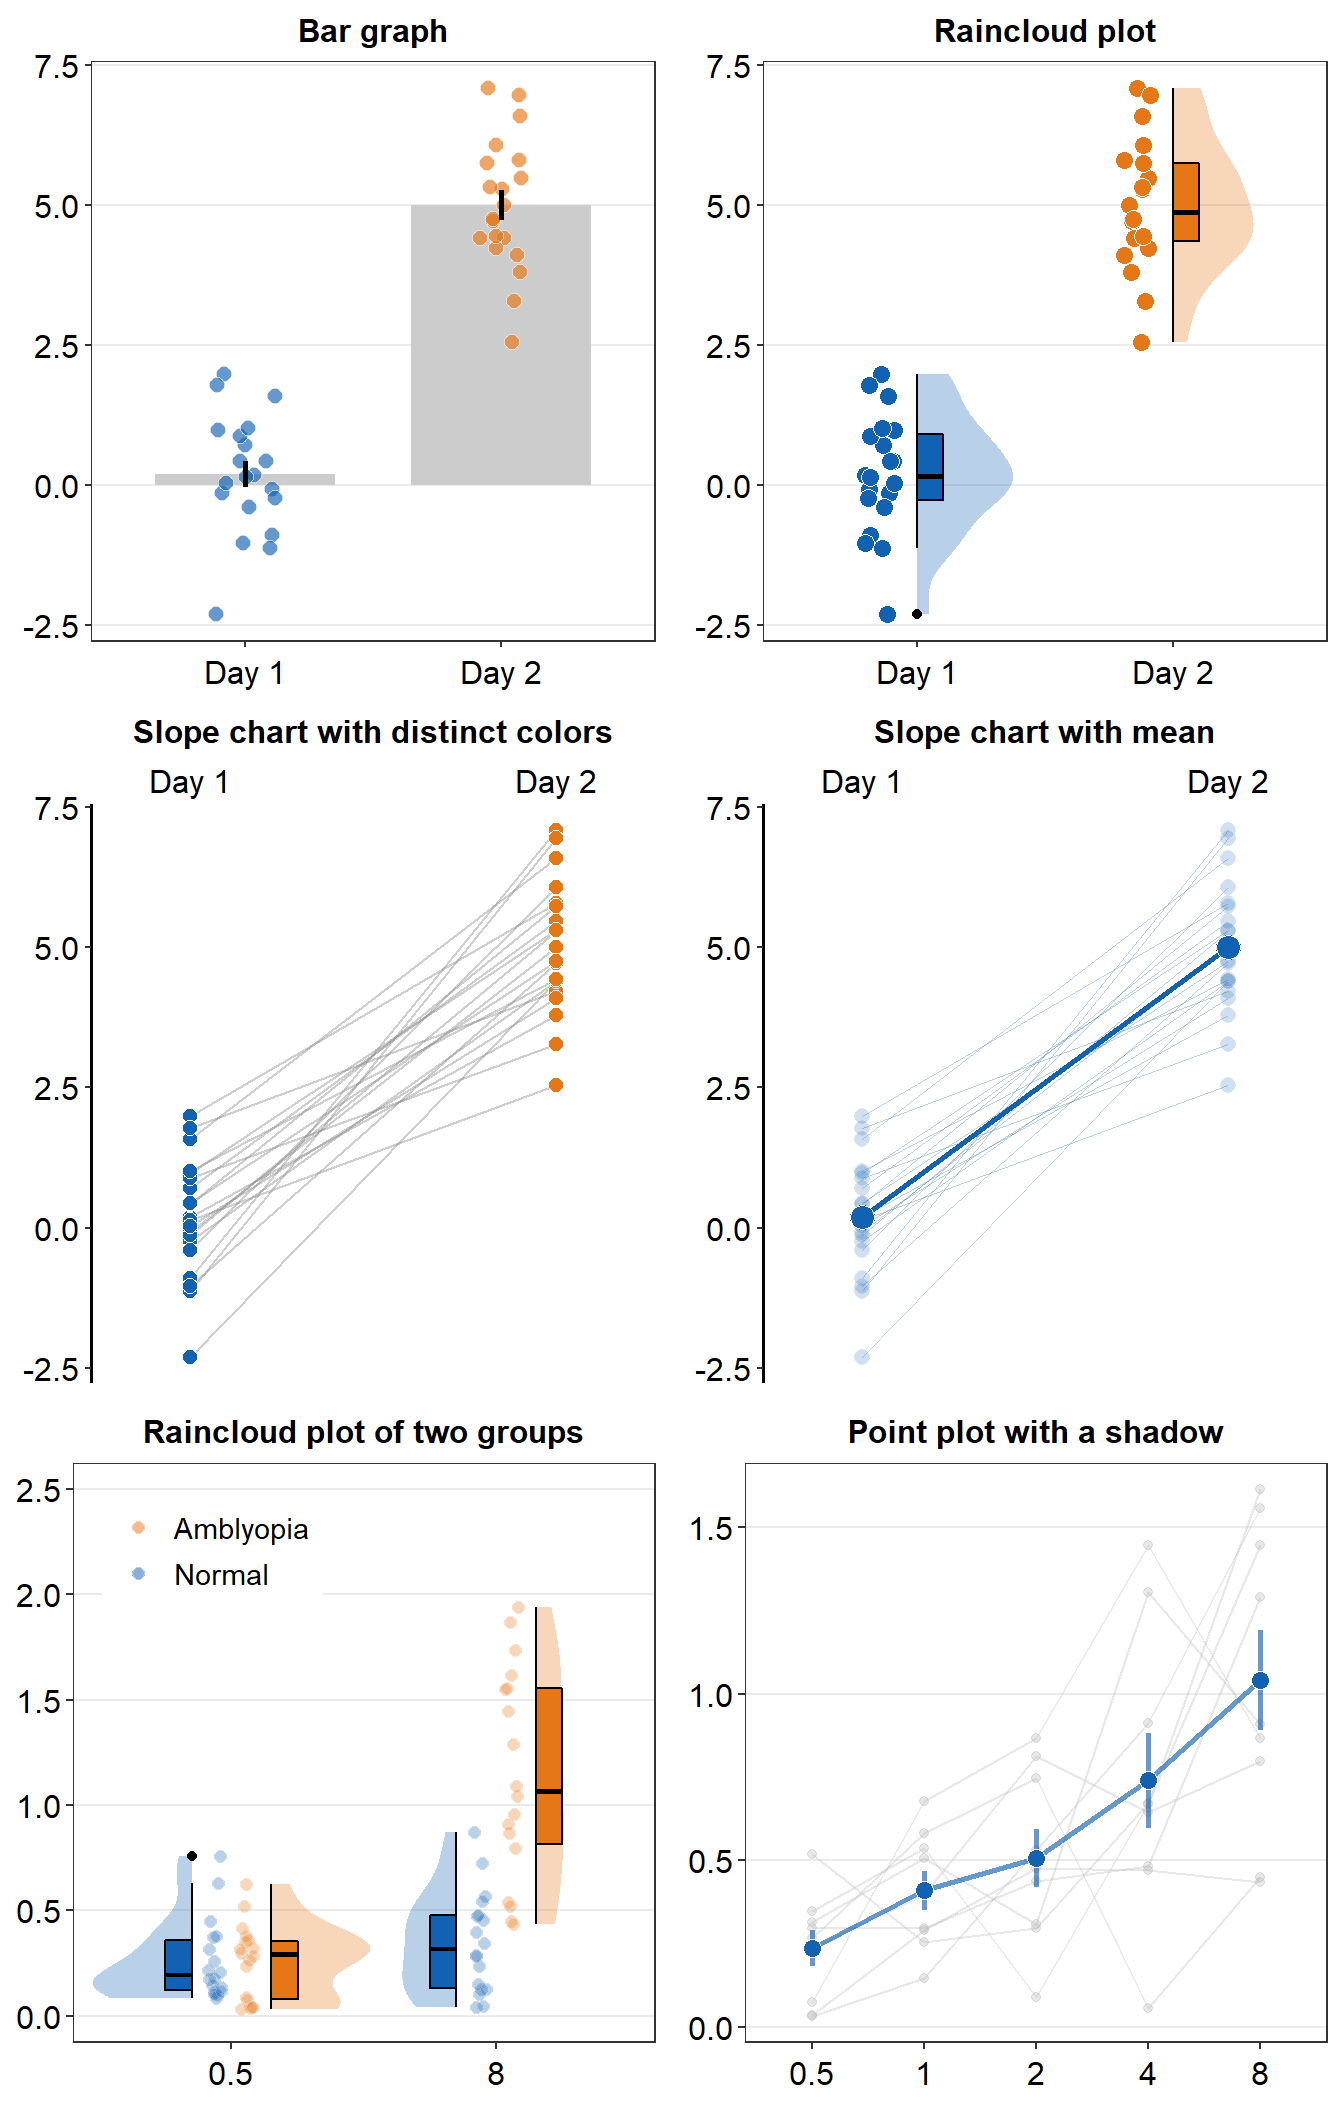
Figure 0.1: Standalone plots created with smplot2. Visit chapters 3-6 for more information.
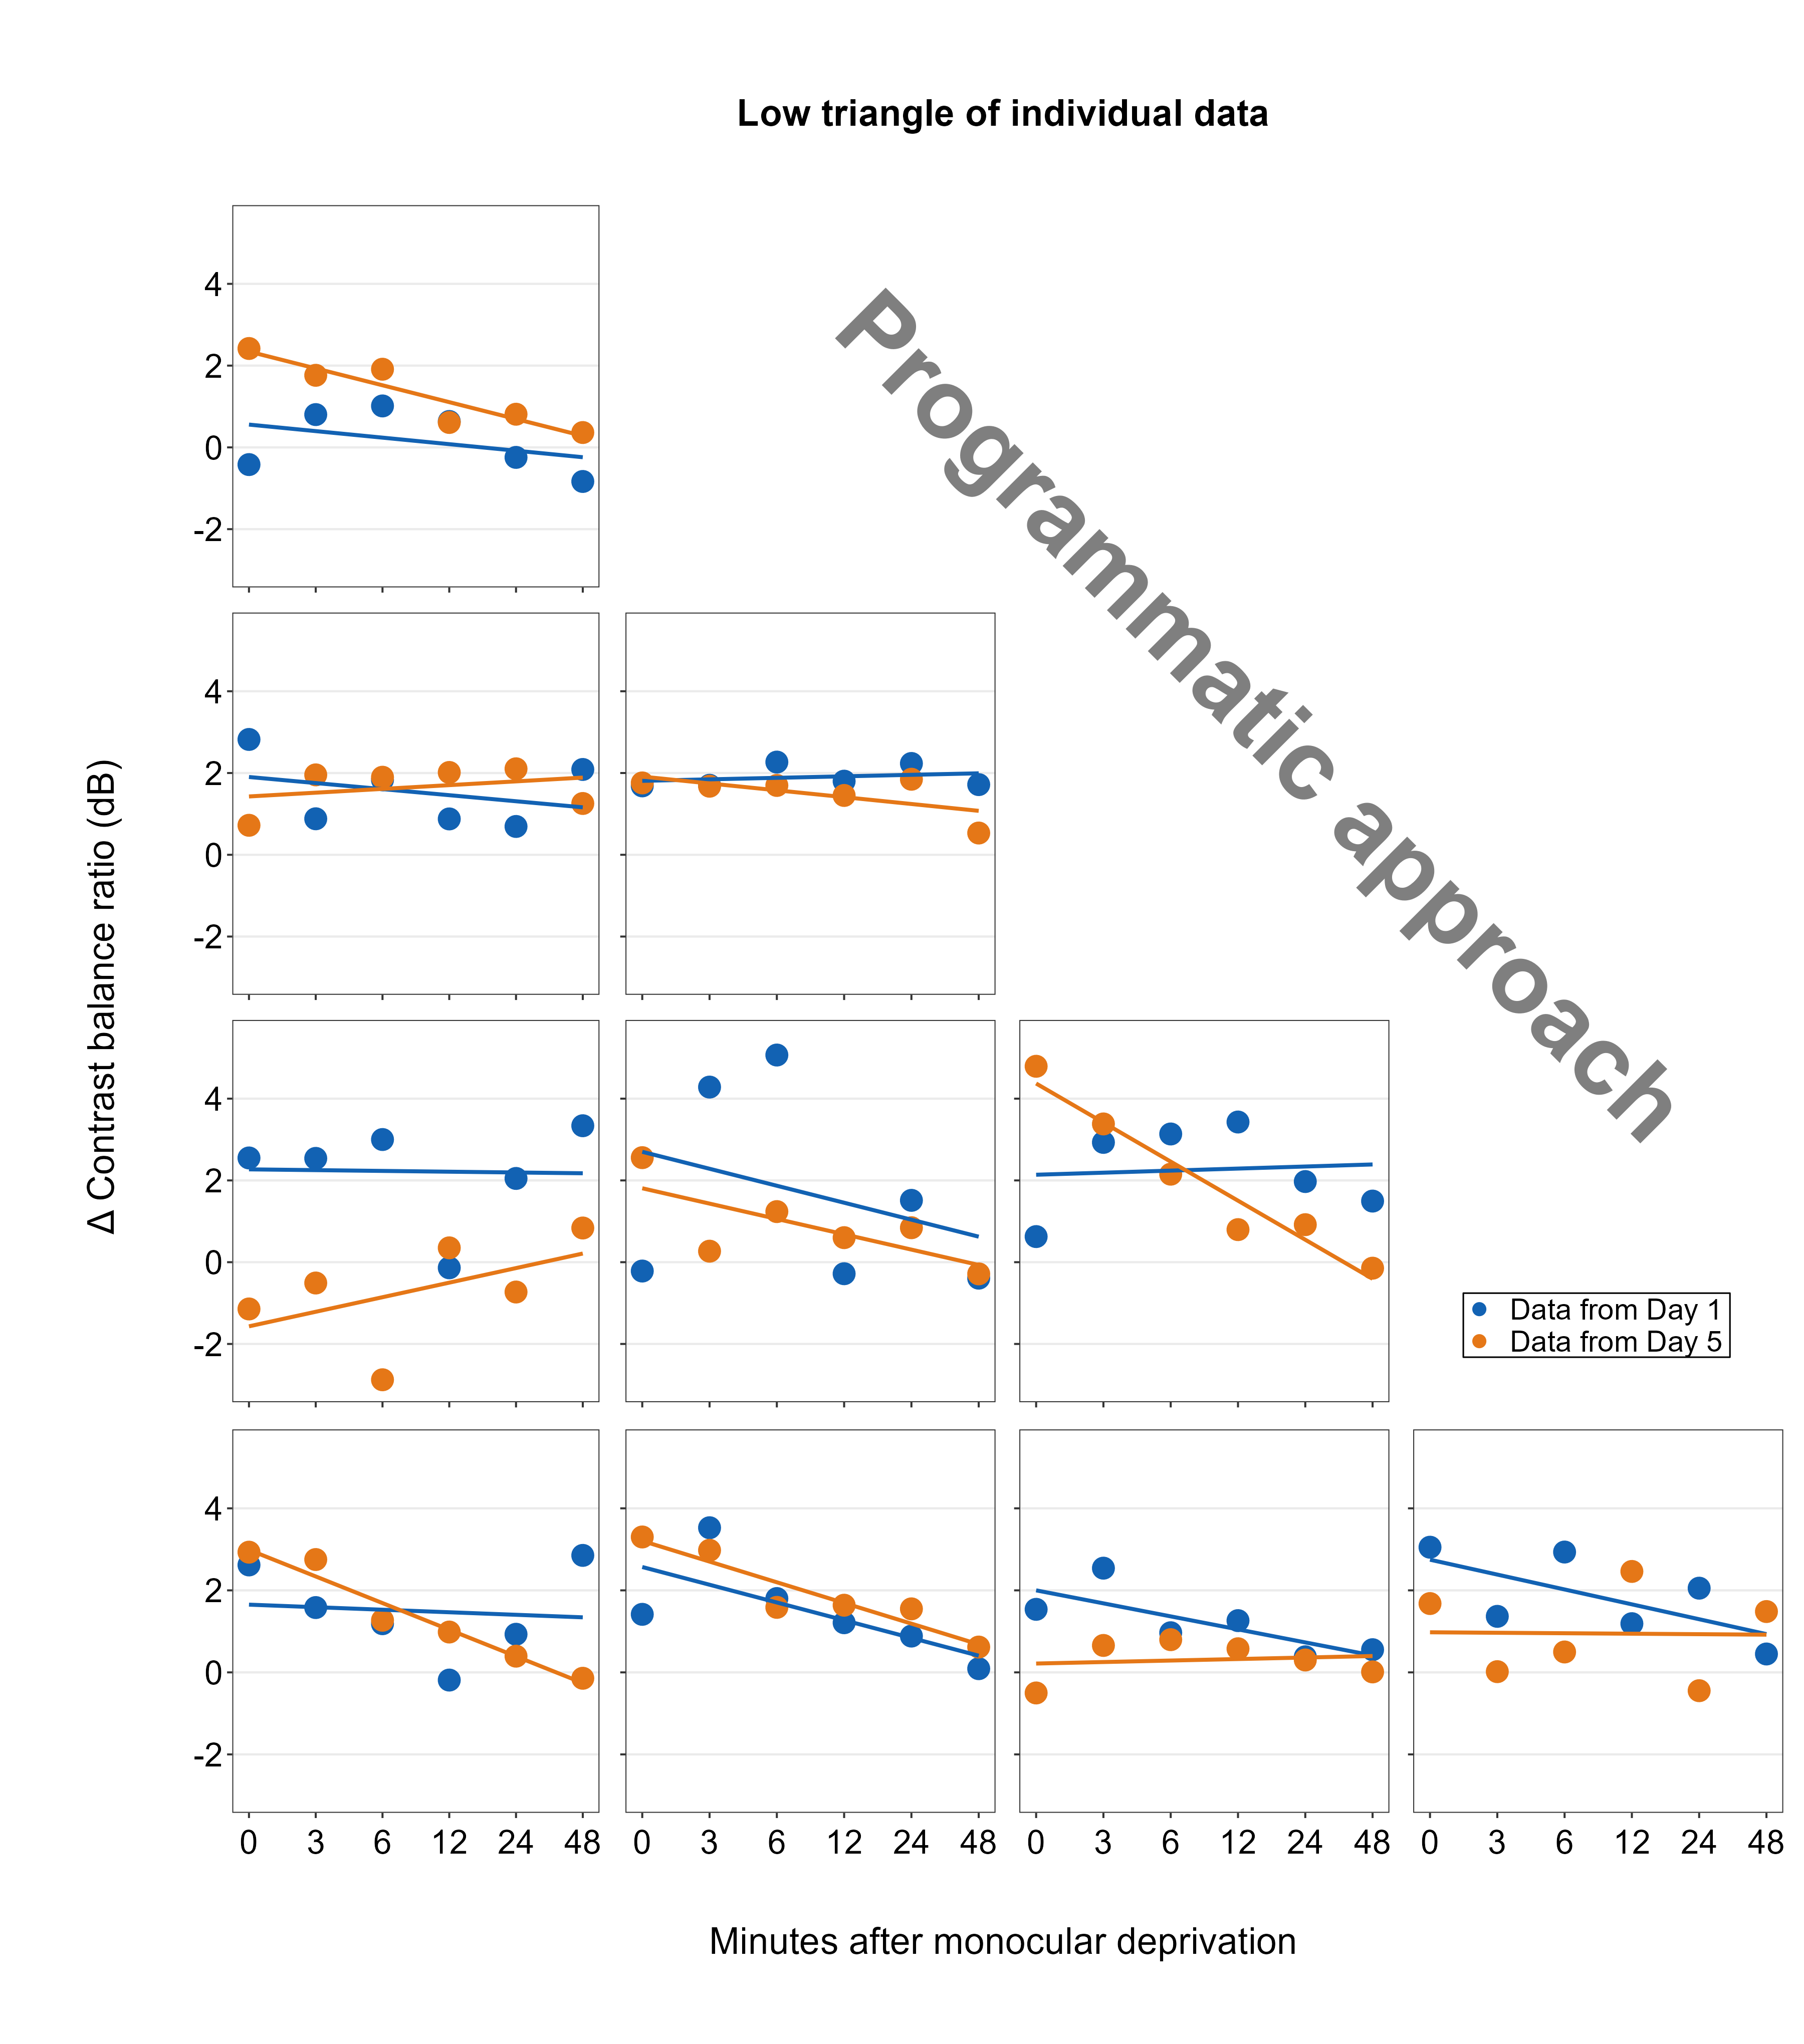
Figure 0.2: A composite plot generated with smplot2. For more details about creating and annotating a composite figure using programmatic constructs and smplot2, please check out Chapter 7.
This guide (https://smin95.github.io/dataviz) aims to familiarize the reader with R, a programming language, for data visualization. It also introduces the R package smplot2, which aims to make the process of data visualization simple. This guide was created entirely using bookdown for reproducibility. The secondary link of the guide is: https://smin95.com/dataviz.
The archived website on smplot can be accessed using this link (https://smin95.com/dataviz0).
Citing the guide and my packages
If you have used the guide and one of my packages, please cite the most appropriate paper(s) from below.
For smplot2 (please cite one of them):
Min, S. H. (2024). Visualization of composite plots in R using a programmatic approach and smplot2. Advances in Methods and Practices in Psychological Science, 7(3). [pdf] [codes]
Min, S. H., & Zhou, J. (2021). smplot: an R package for easy and elegant data visualization. Frontiers in Genetics, 12, 802894. [pdf] [codes]
For smCSF (Chapters 13-16):
- Min, S. H., & Reynaud, A. (2024). Applying Resampling and Visualization Methods in Factor Analysis to Model Human Spatial Vision. Investigative Ophthalmology & Visual Science, 65(1), 17-17. [pdf]
Installation of smplot2
![]()
In April 2024, smplot2 joined the CRAN repository. Please install using install.packages() for the most stable version.
If users wish to download the most updated version of smplot2, please use install_github(). This might be necessary if some codes from the documentation webpage do not work in RStudio as intended.
Issues and contact
If you spot any mistakes in the guide, please pull-request on Github or email me seung.min@mail.mcgill.ca. If you find issues with the smplot2 package, please pull-request on Github.
License
This tutorial is under a Creative Commons Attribution 4.0 International License. I am the sole creator of smplot2.